Shark Pattern: Explained

It was first mentioned by Scott M. Carney back in 2011 and is now owned by Harmonic trading. Its founder, Harold M. Gartley, describes the pattern in detail in his book "Profits in the Stock Market". Essentially, the shark pattern is a 5-O price pattern that promises quick trend reversal.
While the pattern does remind of other ones, like Double Top or Double Bottom, it is different at the core. Detection of the reverse points is impossible without the Fibonacci lines. Otherwise, there is no way to tell whether the pattern is accurate. We are going to describe the way the Shark pattern forms and things to look out for when contemplating opening positions with its help in this article.
How does it form?
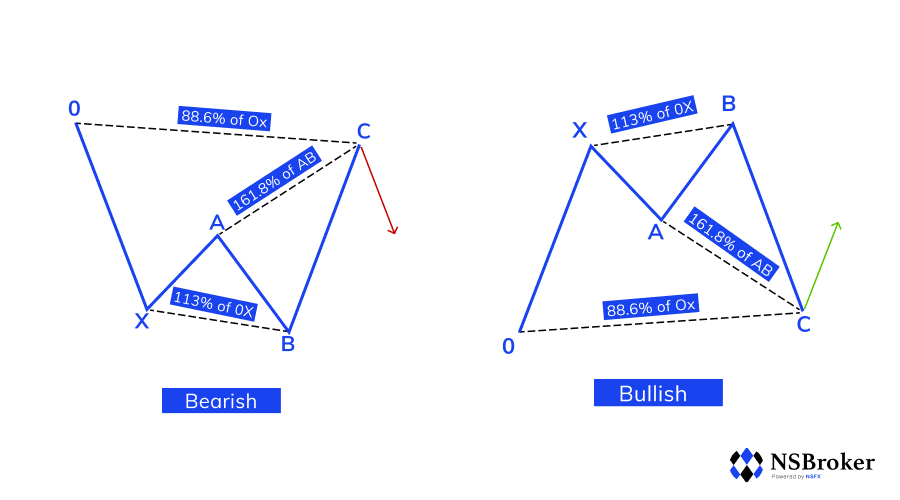
The pattern is made up of 5 points that form on the chart one by one: 0, X, A, B, and C. The idea is that the pattern ends up looking like a shark with its jaw open. Although the points might seem enough, it is too early to make any conclusions without the Fibonacci levels.
How to use Fibonacci levels?
Each trading platform offers the Fibonacci lines tool, but they are not quite what we need for this. In order to apply them to the Shark pattern, delete all the default levels (except "0") and write in 0.866, 1.13, 1.618, 2 24.

A Bullish Shark
The same rules apply here, the price movement starts at 0 with X at its lowest point. There is a pullback in A, which is followed by the comeback of the lows in B. The biggest rising wave is between the B and C. When checking the pattern, make sure that B is within 1.13 and 1.618, C is in 0.899-1.13. The Shark pattern can only be considered intact when these numbers are correct.
How to use the Shark pattern for trading?
Do your research and make sure you know how to spot the pattern. The rules described above are extremely important, however, there are cases in which small nuances can be excused. If you are looking to buy, start with finding the beginning of the pattern on the chart. It is advised to set a wide timeframe as a small one can give a lot of mixed signals, which can cost you a lot. Two highs with the second one being higher can be the beginning of the Shark pattern.
Once the starting point is detected, mark 0, X, A, and B on the chart. Check the placement of the B point and see if it is followed by a temporary price descend, which comes back up at C. Check each point to make sure they fall within the earlier mentioned numbers. If everything checks out, open your position when the price is rising from 1.618 and set stop loss to point C. Take profit should be in the center point between points A and B. Let’s now get into your course of action in case of opening a selling position.
You should look for pretty much a mirror reflection of the pattern described above. Find two lows with the second one lower. This can be a beginning of a Shark pattern. Start off with marking down points 0, X, A, and B on the chart. Make sure point B is within 1.13 and 1.618. If the price starts rising and then goes back down, this is where you should mark point C. Make sure it is within 0.86 and 1.13. If all numbers are intact, open a selling position when anticipating a bounce off 1.618. Set stop loss and take profit the same way as for the buying position case.
Although the Shark pattern is a relatively new phenomenon in the trading industry, it has proven itself useful to countless traders. It might seem difficult to detect it on the chart, but as with everything else, experience and practice make it easier.


