Forex Weekly Forecast & FX Analysis April 12 - 16

EUR/USD
The euro is attempting to form an uptrend against the US dollar. This can be clearly seen both in the chart and in the indicators. If we consider the price chart, it is very important to note that the price turned out to be above the level of the moving averages and above the important level of 1.1863. As for the indicators, the histogram is at its maximum values and itself, and the oscillator has already moved from the oversold area to the overbought area. Taking into account the location of the price and the tendency of this currency pair to an upward movement, we can expect a continuation of the upward movement.

GBP/USD
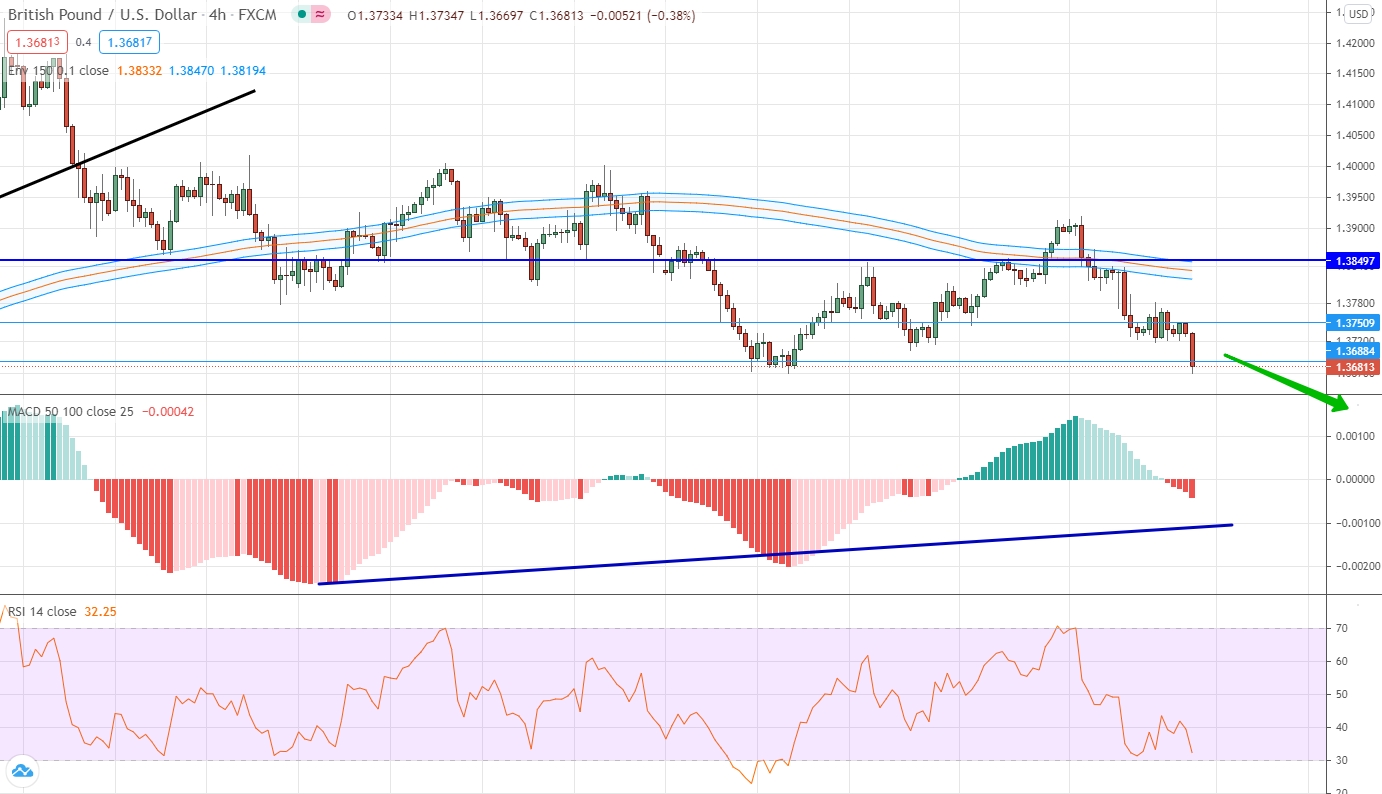
A downtrend prevails for the British pound against the US dollar. If we look at the price chart, we note that the price is below the moving averages, while the moving average itself is looking down. The price is also below the important psychological level of 1.3850. In this regard, we can talk about the presence of a downtrend and open a contract for a fall. At the same time, the positions of the indicators do not reject this hypothesis.
USD/JPY
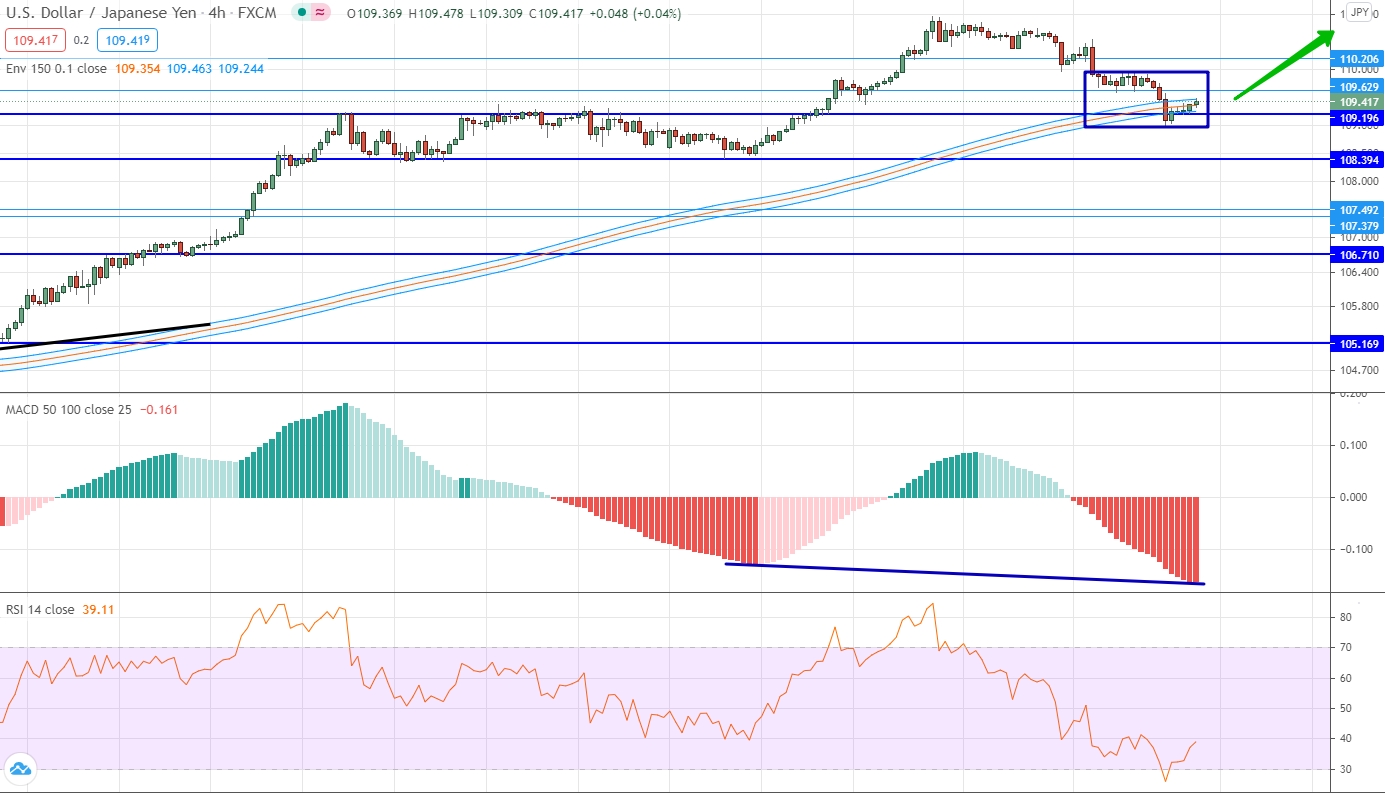
The US dollar against the Japanese yen over the past week made a non-volatile, but still downward movement. As part of this movement, the price was in the area of 109.196 and at the same time in the area of the moving averages. At the same time, the indicators are all looking down, the oscillator has reached the oversold area, and the histogram is testing its minimum values for more than 2 months. It is logical to assume that the current point is the minimum of a pullback, which means that you can open a contract for a fall in the direction of the main trend.
AUD/USD
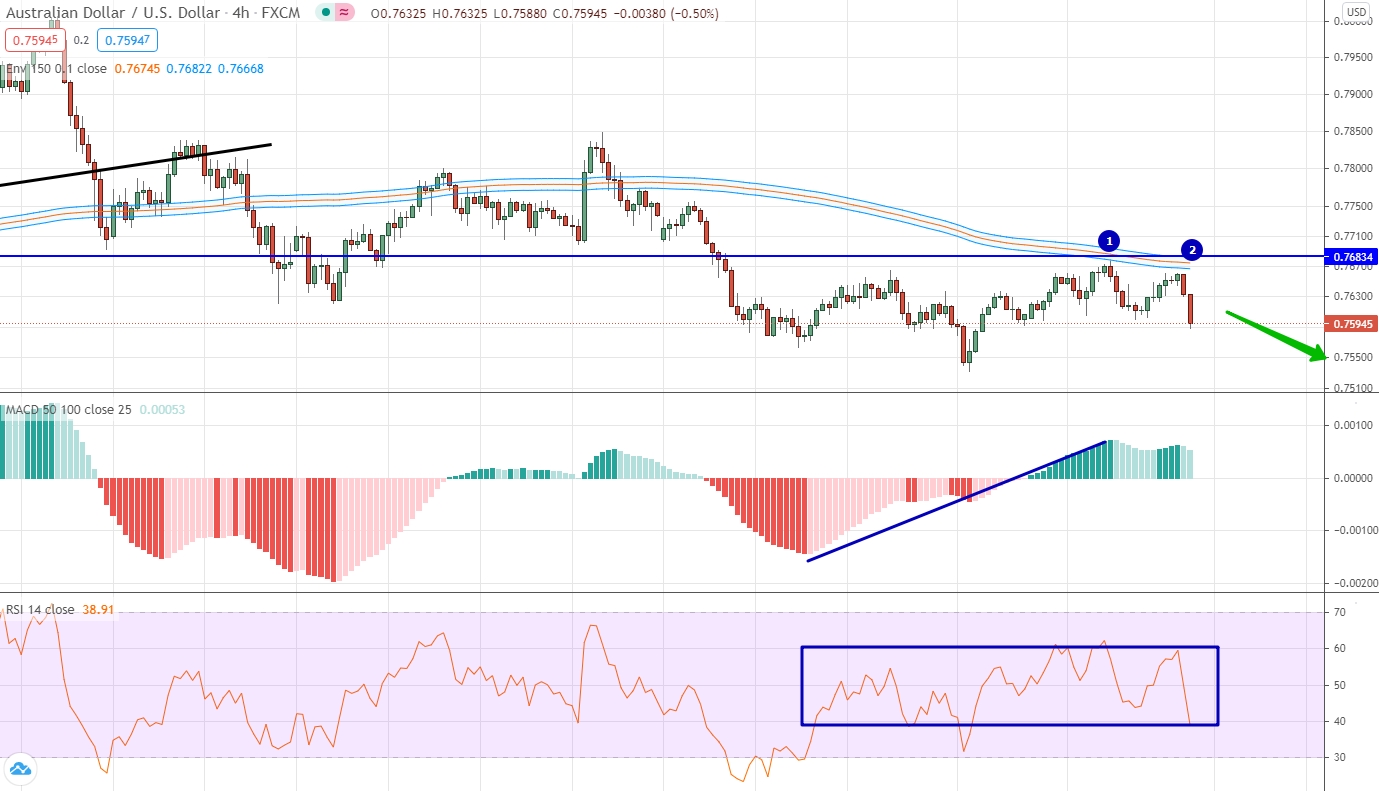
The Australian dollar continues to develop a downtrend against the US dollar, although a sideways movement is more likely to be observed within the last week. It is very clearly visible on the oscillator, which is not able to significantly move away from level 50. The histogram is also plotted close to zero values. Therefore, we pay the main attention to the price chart and there, first of all, it should be noted that the price tested twice the level of moving averages, which coincided with the price mark 0.7683. There was no upward breakdown, which means you can trade down.
USD/CAD
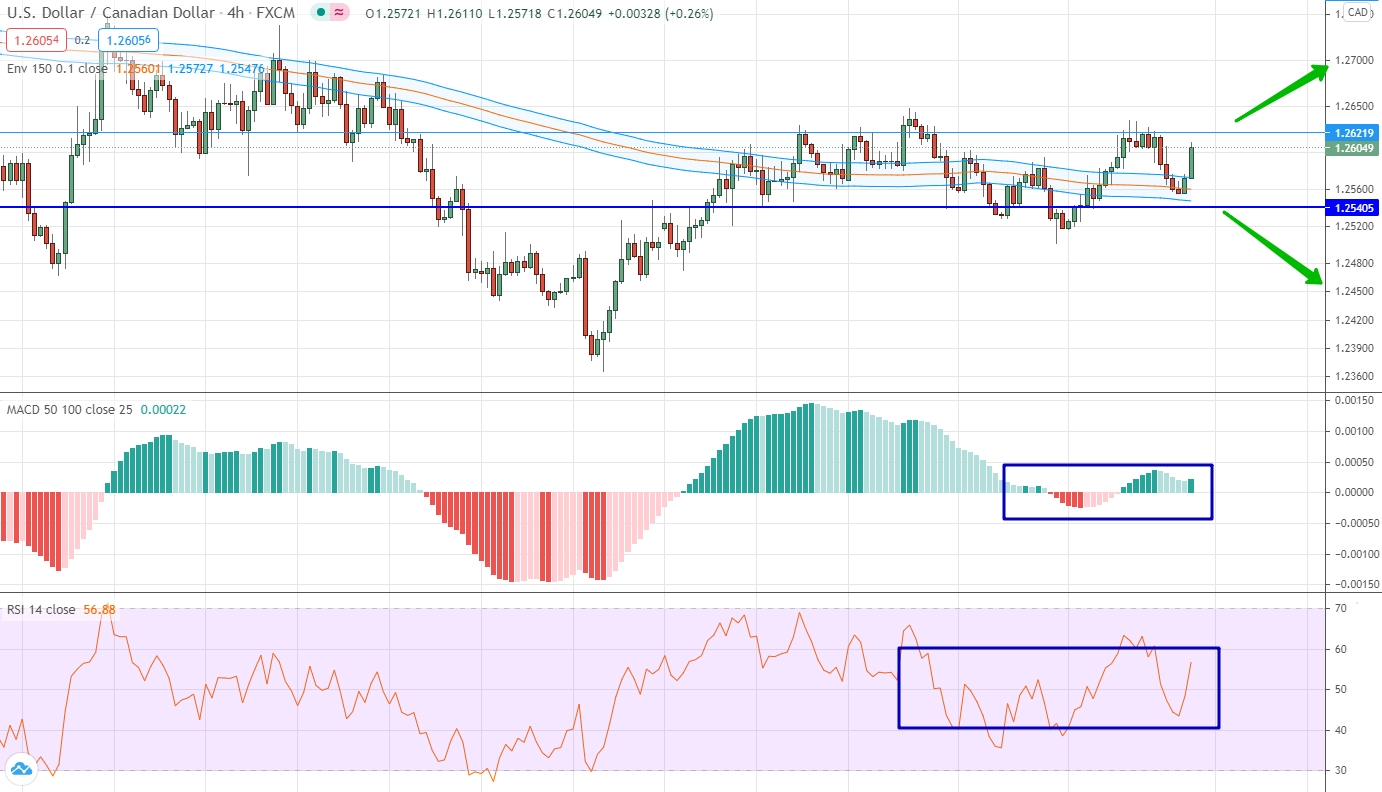
For the US dollar against the Canadian dollar in the current market situation, a side channel with the boundaries of 1.2540 and 1.2622 can be distinguished. The level of moving averages is located inside this corridor. Indicators are plotting close to neutral values and confirm the significance of the current sideways range. Therefore, we can say that while the price is within this range, it is impossible to trade, since there is a sideways movement where there is practically no volatility. We are waiting in which direction this range will be broken and a contract can be opened in the direction of the breakdown.
USD/CHF
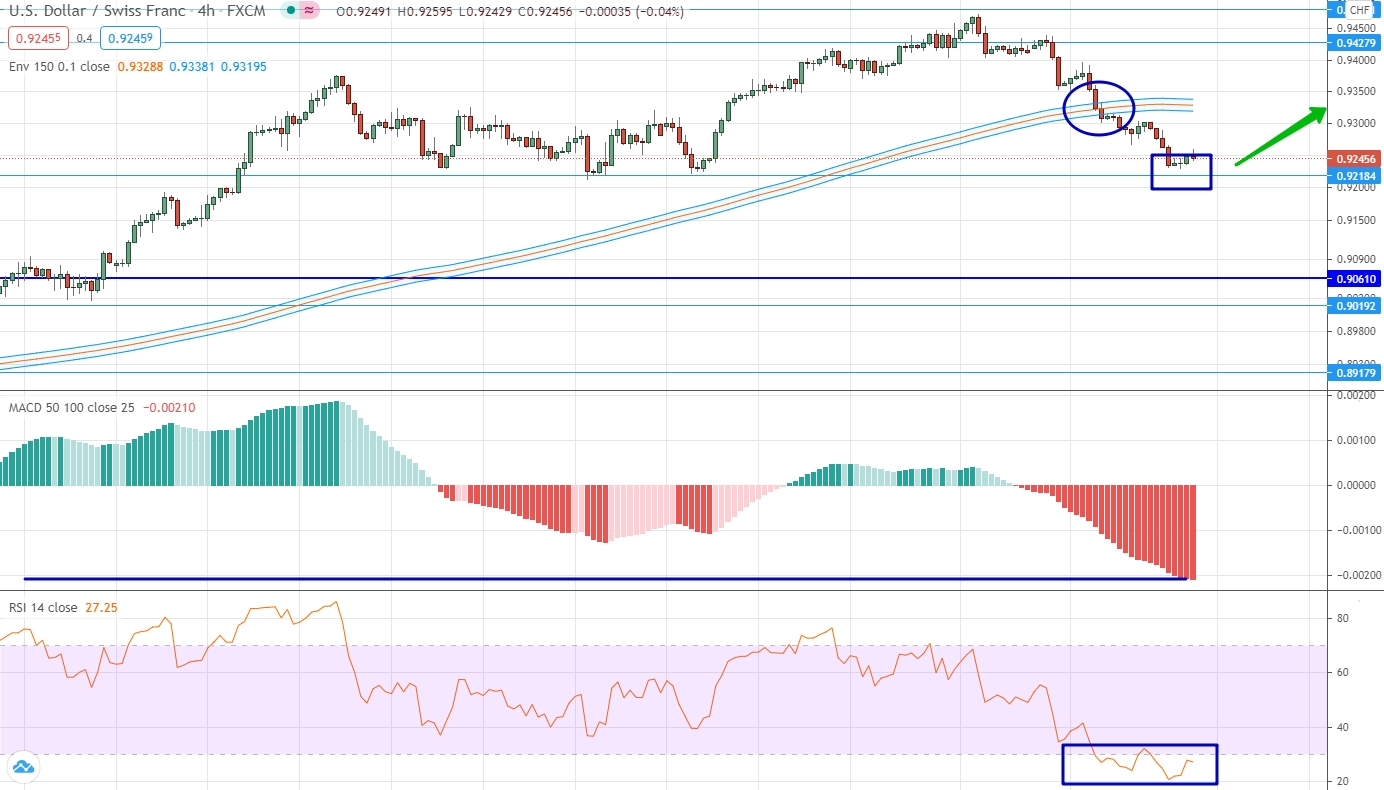
The dollar against the Swiss franc made a rather strong downward movement last week, as a result of which the price fell below the moving average and reached the important level of 0.9218. The indicators confirm the downward movement and are at their minimum values for more than 2 months. The oscillator is in the oversold area at all, it has tested the level 20. Taking into account the combination of factors, we can expect that at the level of 0.9218 the correction will complete and the market will return to the growth stage. Therefore, you can open an upward contract.
USD/RUB
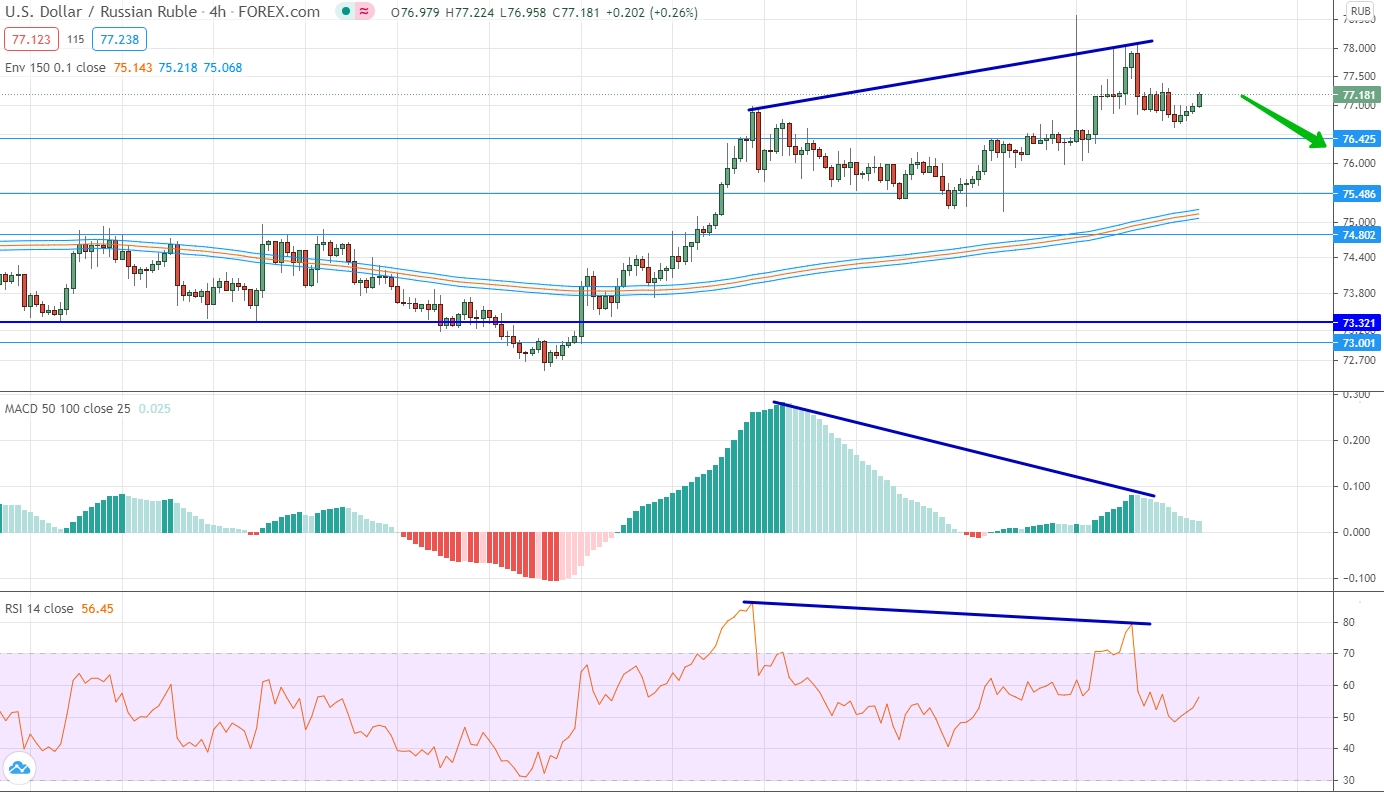
The past week has led to an increase in the value of the US dollar against the Russian ruble. The trades turned out to be unambiguous and quite volatile. If an uptrend is unambiguously traced on the price chart, then everything is not so unambiguous with indicators. Moreover, we are talking about the indicators looking down and the price looking up. Thus, divergence can be traced. Taking into account the presence of divergence and moving away of the price from the level of moving averages, we can expect that the market will need a downward correction. Therefore, we open a downward contract.
Gold
Gold made a strong and impulsive upward movement, creating the preconditions for an uptrend and opening a long-term up contract. First of all, we note the fact that the upward movement began from the area where the oscillator was below level 20. As for the price, it initially rose above the moving average level, then tested the level of 1734.521 and then consolidated above this level. An equally important point is that the moving averages have already changed their slope to an upward one. Therefore, we have all the prerequisites for opening a raise contract.


