Forex Weekly Forecast & FX Analysis July 22 - 26

table.of.contents.label
table.of.contents.show
EUR/USD: Bearish
The previous week’s price action was rather consolidative than reversing, according to the daily chart below. Euro bulls failed to lift the pair above crucial technical resistance levels. The round-figure horizontal static line at 1.1300 held rates from further appreciation, while two tests of 21-day simple moving average failed to succeed. On the other side, the bears did not print significant achievements below 1.1200 handle. The technical sentiment remains negative as MACD histogram kept charting red bars below zero, while both lines point south with a bearish surplus. Fast Relative Strength Index with 13-days period failed to continue the upwards performance above the 50% threshold, and dropped below the line, pointing strong bearish momentum. A crucial defensive barrier for EUR/USD is the lowest recent daily close rate at 1.1194. If the bears managed to close a day below it, then the pair could extend losses towards the multi-months lows in the range of 1.1129/1107. An alternative scenario suggests a bullish bounce back to local resistance at around 1.1300 handle.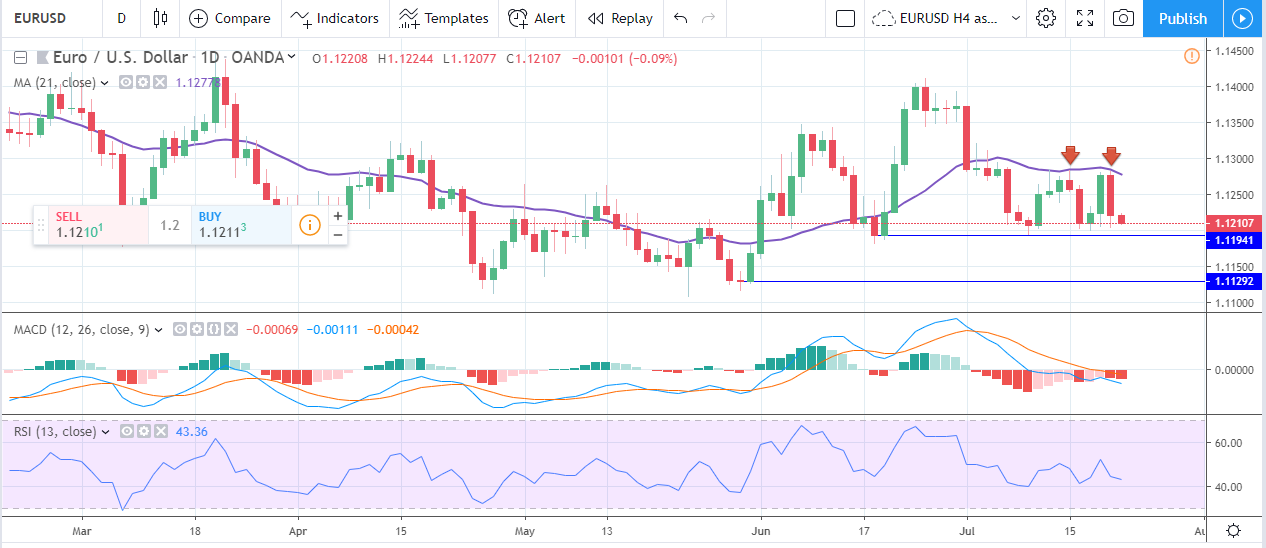
GBP/USD: Bearish
The British Pound had tested 1.2400 support for the first time since April 2017. The bearish trade triggered a significant amount of postponed buy-orders and take-profits, lifting GBP/USD towards local resistance at 1.2550. However, the recent performance confirms that the bullish rebound is over, and the pair is ready to re-write the local bottom. On the other hand, there is a threat of charting a head-and-shoulders reversal pattern with the descending neckline at around 1.2462/54. Potential bullish divergence in RSI oscillator is not confirmed by the MACD trend indicator yet. However, several upcoming days should clarify uncertainty. If RSI continued diverging with the price action, and MACD lines formed another higher low, then the likelihood of short-term deep retracement if not long-term trend reversal would rise. The danger of changing the technical sentiment would ease if GBP/USD breached the local low of 1.2382 and closed a day below 1.2400 round-figure support.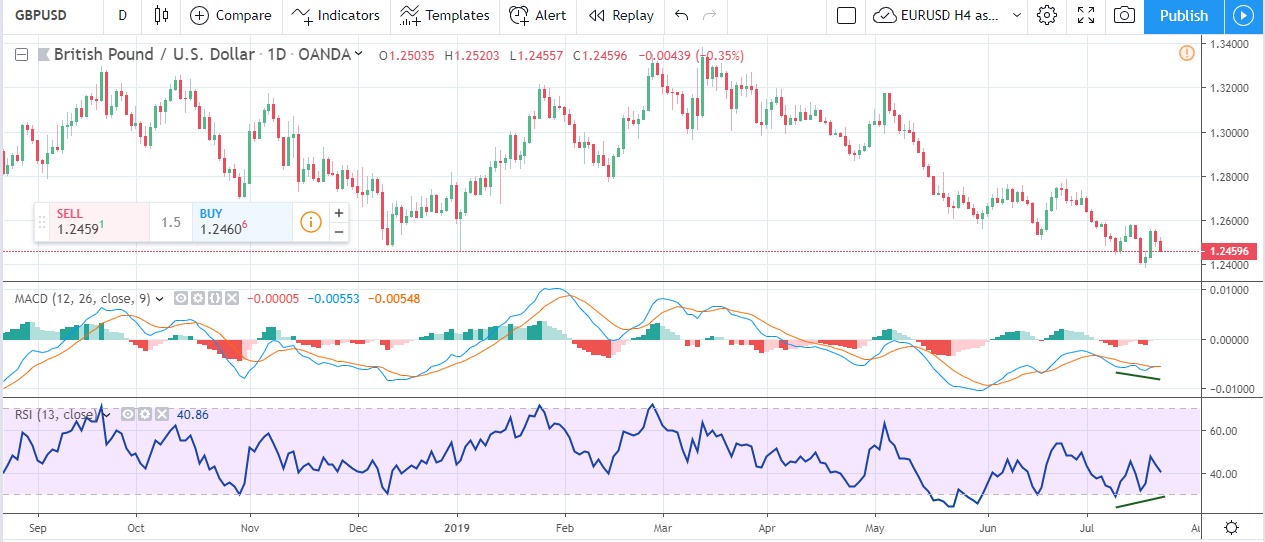
USD/CHF: Bearish
In contrast to Euro and Sterling, the Swiss Franc gained strength versus the U.S. dollar this past week. USD/CHF was testing 0.9900 handles again, but those attempts were not able to overcome the volume of offers at that level. The daily chart setup (see the screenshot below) shows a clear descending triangle with the baseline at 0.97177, the lowest daily close rate since September 2018. The dynamic resistance is represented by 55-days exponential moving average, coming at 0.99233 currently. If the pair breached the baseline support, we might see USD/CHF trading at around 0.9300 as the triangle’s workout depth exceeds 400 pips (for 4-digits quote). An intermediate pit-stop at 0.95424 (12-months low) could halt the bearish rally for a while as the bears would need to gather the momentum and reload oscillators. Both Bollinger Bands %B and Commodity Channel Index are bearish with plenty of room to go south before reaching the oversold territory.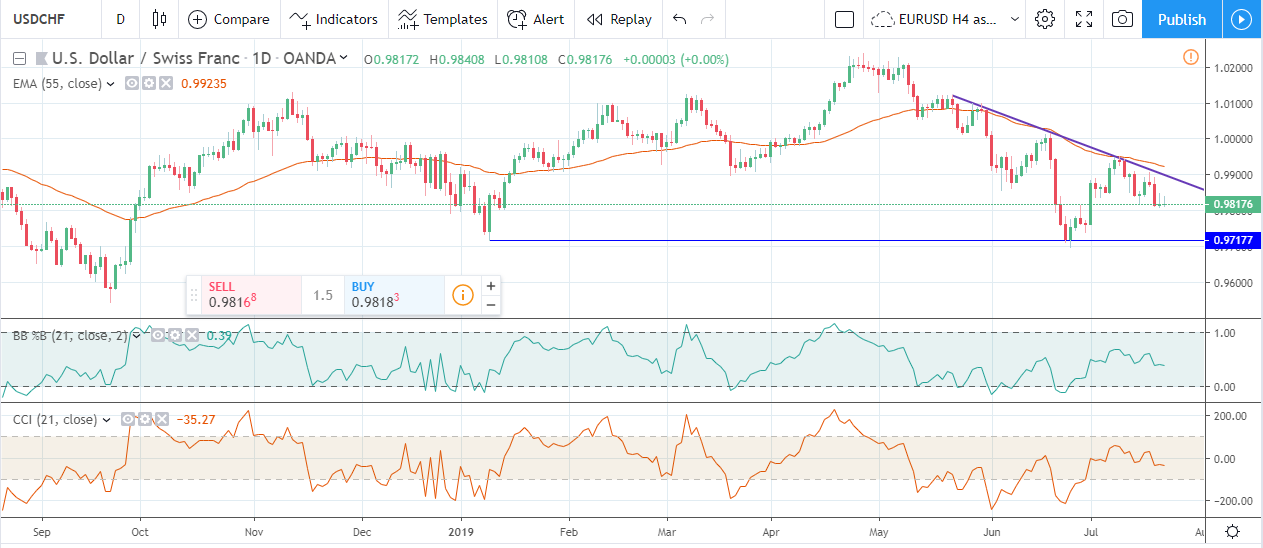
NZD/USD: Bullish
The New Zealand dollar was the strongest currency versus the greenback this past week as the NZD/USD exchange rate gained more than 1.05%. Ichimoku Cloud trend indicator had completed the bullish reversal pattern as the span performed the bullish cross and the rate breached the upper band of the cloud, charting the bullish breakthrough on Monday. Since then, the positive surplus enlarged as NZD/USD continued the rally towards 0.6800 round-figure handle. Daily resistance is placed above 69 cents, as the local top was reached in January - March this year. However, such sharp price action could turn into a crash without healthy retracements. Ichimoku Conversion line should act as the support curve, limiting potential bearish retracements. The curve is ascending and comes at 0.6680 as for Monday, July 22. Intraday charts could also work as indicators for possible correction depth. Given the overall positive technical sentiment, the buy-dips trading strategy is preferable.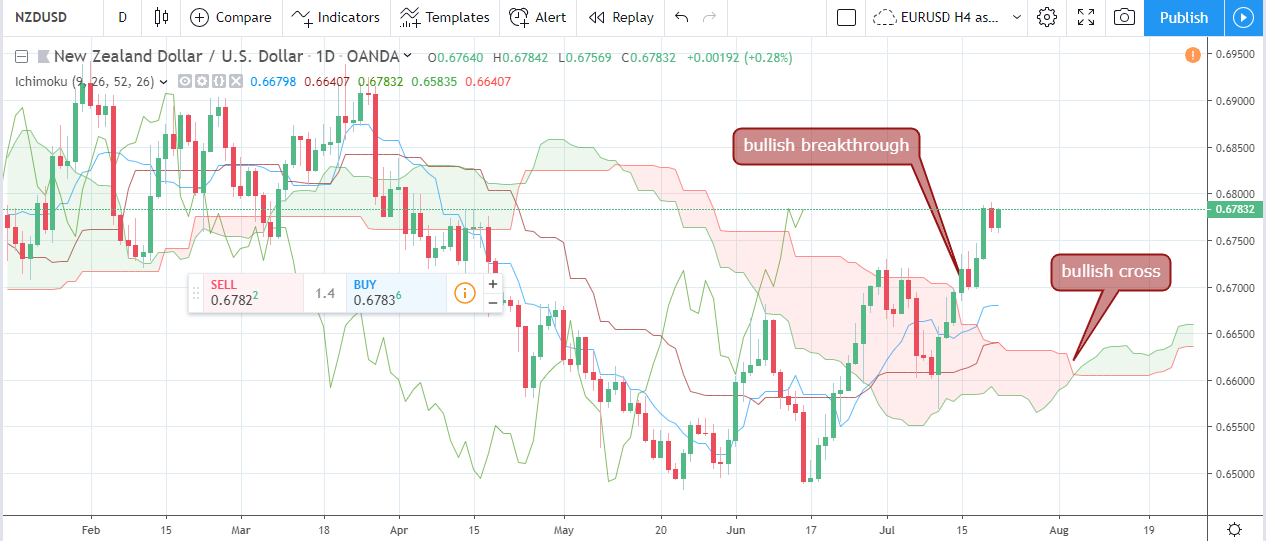
USD/CAD: Neutral.
The Loonie failed to keep strengthening versus the greenback. USD/CAD is stuck above the essential psychological level of 1.3000, hovering in a tight range of 70-90 pips last week. That sideways range allowed some forex speculators playing ping-pong with the pair, gaining on the market’s indecisive mood. The past week was closed right in the middle of the range, adding uncertainty to the equation. However, the four-hourly chart has a potential sign of a deep bullish retracement as 34-bars Bollinger Bands has a bullish breakthrough signal. If the sign was not fake, then USD/CAD could bounce up to 1.3200 handle and 1.3225 in extension as the bears’ inability to crack the nut of 1.3000 could be comprehended as a weakness. Alternatively, the sellers could gain momentum and breach the support in case if the demand for the U.S. dollar softened across the board.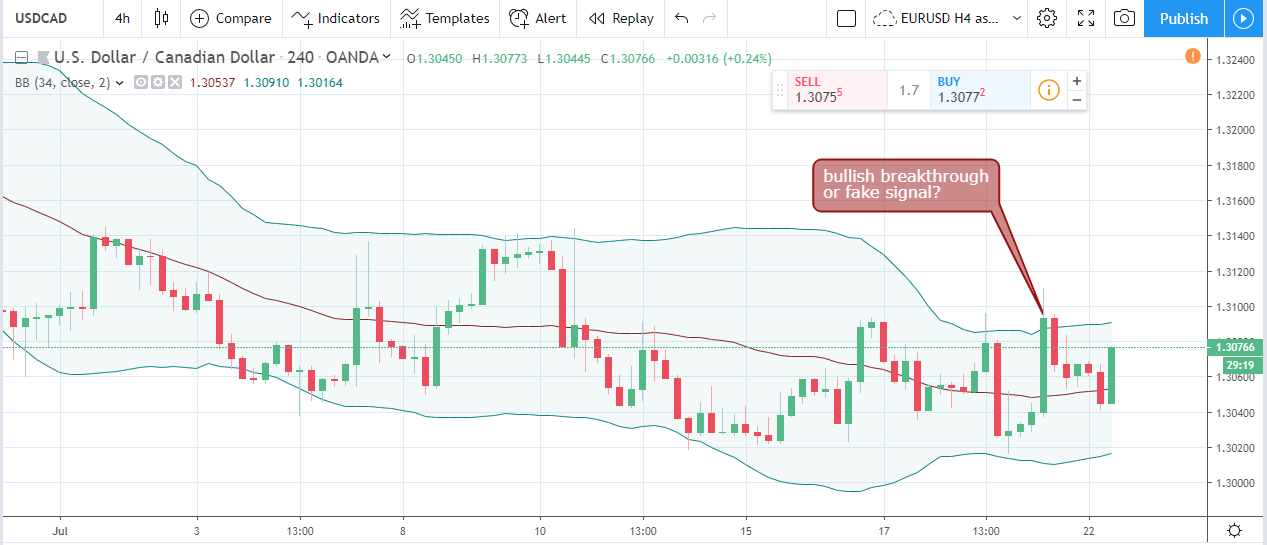
GOLD: Bullish
The yellow metal charted another six-year high this past week. The gold price peaked at $1452.4 per ounce, triggering a large volume of postponed sell-orders, and bouncing back to $1425.0 handle. The long-term technical outlook on the weekly timeframe suggests a continuation of the bullish rally. The graphical analysis of the weekly timeframe shows an ascending channel with the resistance trendline targeting $1500 per ounce for the upcoming month. Gold kept appreciating in 10 weeks out of 11 after breaching the important resistance at $1300. At the same time, crossing the crucial level of $1450 is required to continue the uptrend. Otherwise, a deeper correction could take place with buy-orders placed above $1400 round-figure handle. Shorter timeframes are getting extremely overbought, which could force the precious metal to consolidate gains in a sideways channel in the range of $1420/30. After oscillators reloaded and bullish momentum gained, we might see another attempt to test the latest top.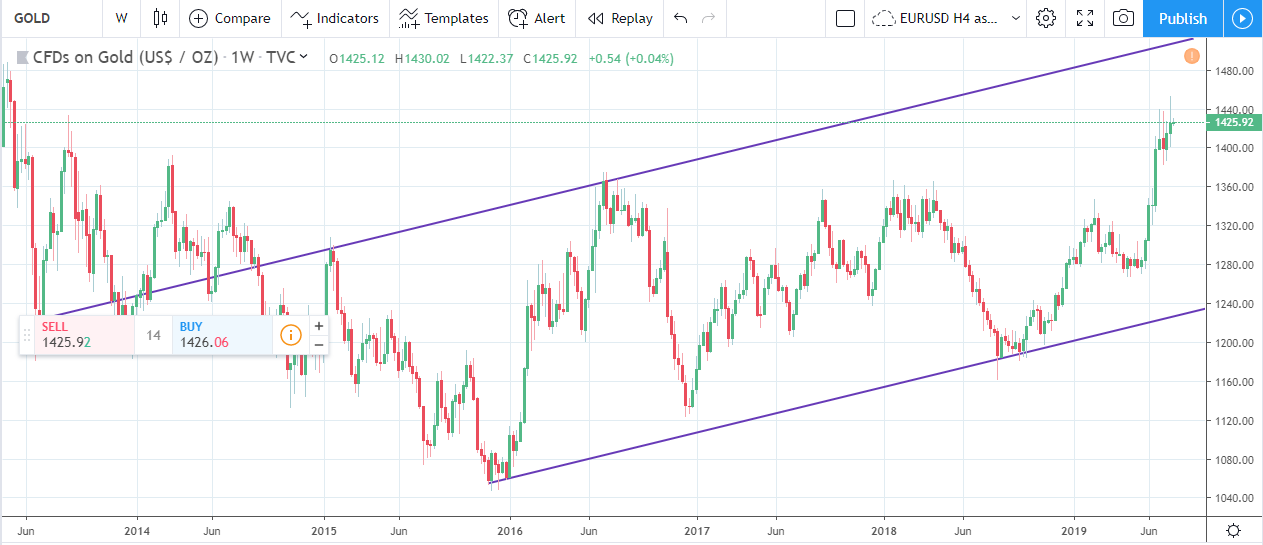
WTI Crude Oil: Bearish
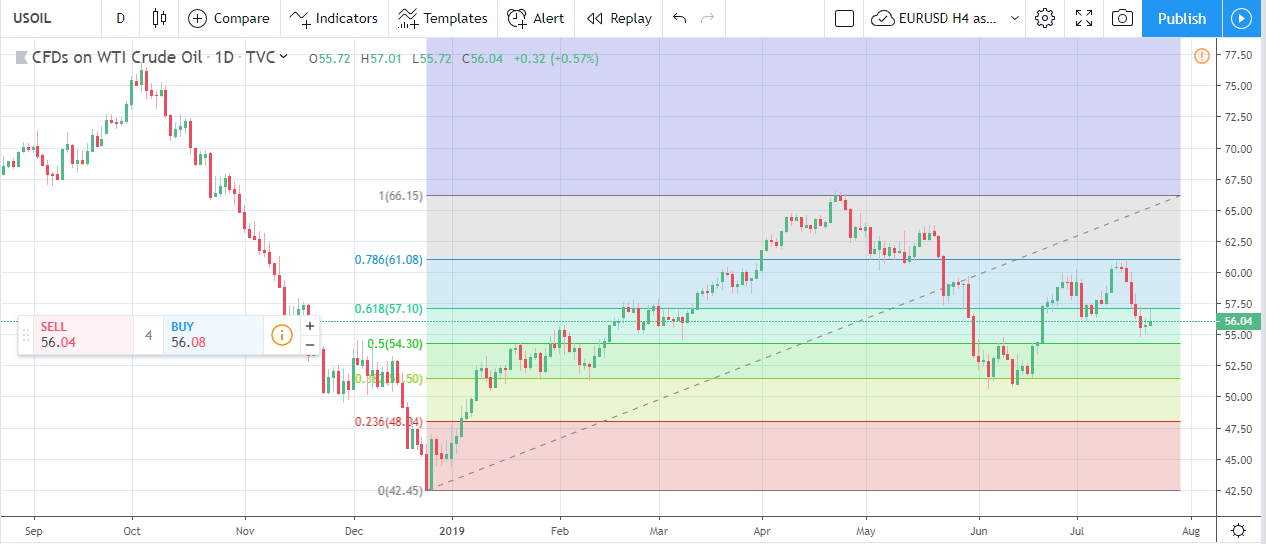
The black gold disappointed traders who were counting on the breakout of psychological round-figure static resistance of $60.00 per barrel charted on July 10. The technical analysis proved insignificance of such calculations as the real resistance was coming at $61.08 - 78.6% Fibonacci Retracement Level of the uptrend started on December 26, 2018. WTI Crude price peaked at $60.89, and the bullish momentum was exhausted. As a result, take-profit flows pushed the rate lower, and the weekly decline exceeded 7.5%. What’s more, 61.8% Fibo levels at $57.10 did not hold the bears and oil prices dipped to $54.76. Sideways consolidation is expected with the bottom at $54.30. If the bears were able to eliminate that support, then the uptrend would be in danger of stalling, and the market would eye recent low at $42.45. So far, the bulls have a chance to save the recovery, but strong demand is needed. The best-case scenario is to lift the rate above $57.10 again. However, given the overall weak sentiment and the speed of the recent decline, such an option is unlikely.