Forex Weekly Forecast & FX Analysis June 14 - 18

EUR/USD
The euro against the dollar is in a corrective upward movement. This is very well traced by the last trend line with a downward slope, as well as by strong levels and moving averages. The trend line of local movement and the level of moving averages form a graphical triangle between them. This is the only signal that can be used in trading for the coming week, since the indicators are in a neutral position and are of no interest for trading. The global trend is upward, so an upward movement can be expected, but to open a contract, you need to wait until the price is above the triangle. If the movement happens downward, then it will be possible to open a downward contract with the target at 1.2083.

GBP/USD
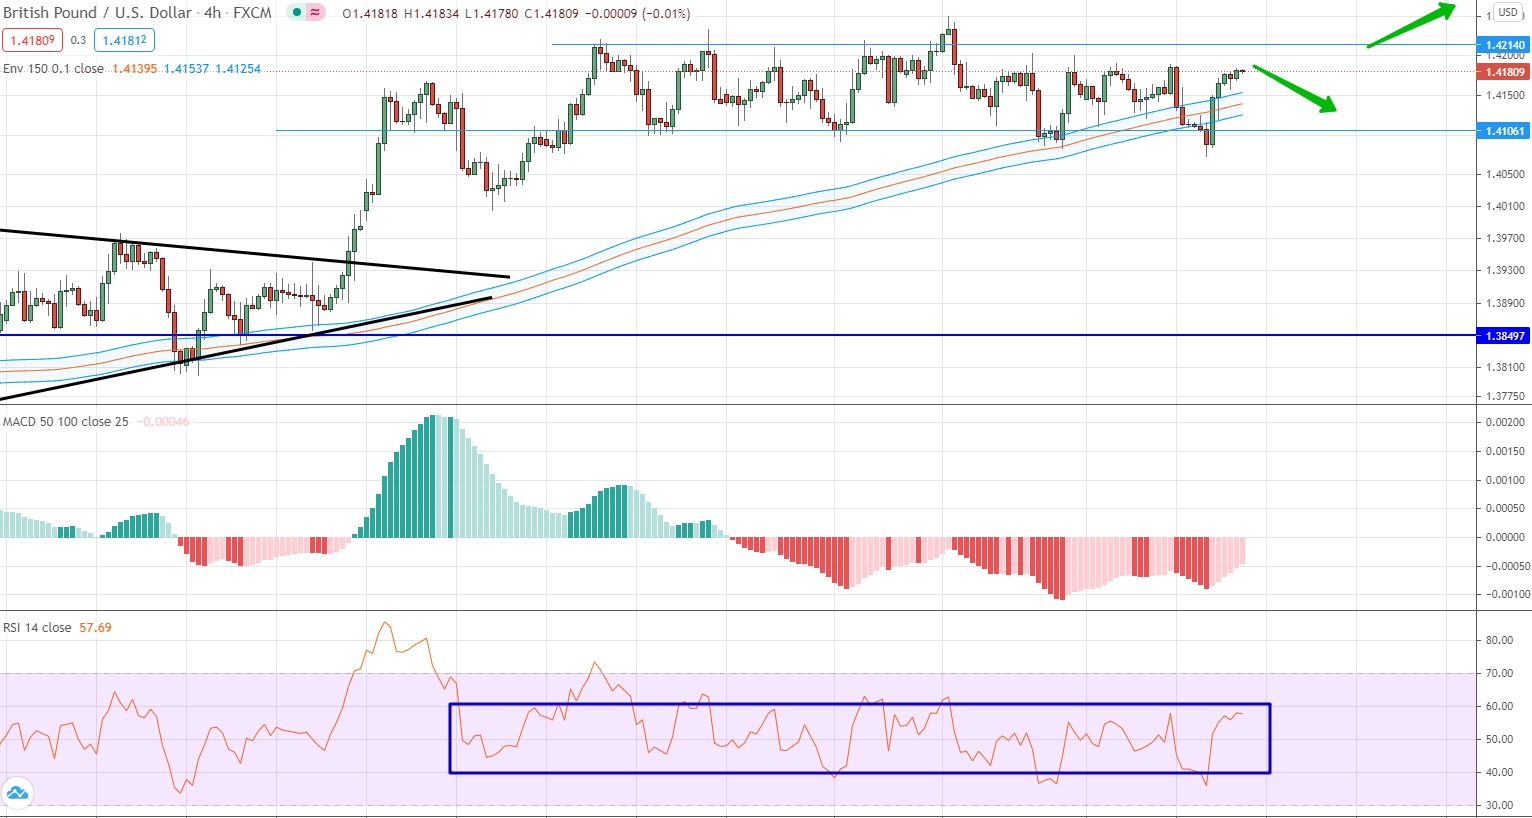
The British pound is still making a sideways correction against the US dollar after a strong growth phase. In fact, we can talk about the same thing that we talked about in the previous weekly review. Indicators are not of interest for analysis, since they develop in a neutral position. As for the price chart, we highlight the range with the boundaries of 1.4214 and 1.4106. We expect that the price will continue to move within this range, and since the last movement was accompanied by reaching the upper border of the channel, we can expect a downward movement. We also take into account that the global movement is upward, but an upward contract can be opened only if the market is above the price channel.
USD/JPY
This currency pair is the next one within the framework of the current weekly review, where we state the fact of the presence of a correctional movement. For the US dollar against the Japanese yen, the current sideways range is the corridor with the borders of 109.630 and 109.200. The indicators are in neutral positions, and this is, first of all, clearly visible on the oscillator. Although the histogram and the oscillator are in the negative area, they do not show a strong movement. Therefore, we start from the price chart and say that you cannot trade while the price is within the range. We are waiting for a breakout and open a contract in the direction of this movement.

AUD/USD
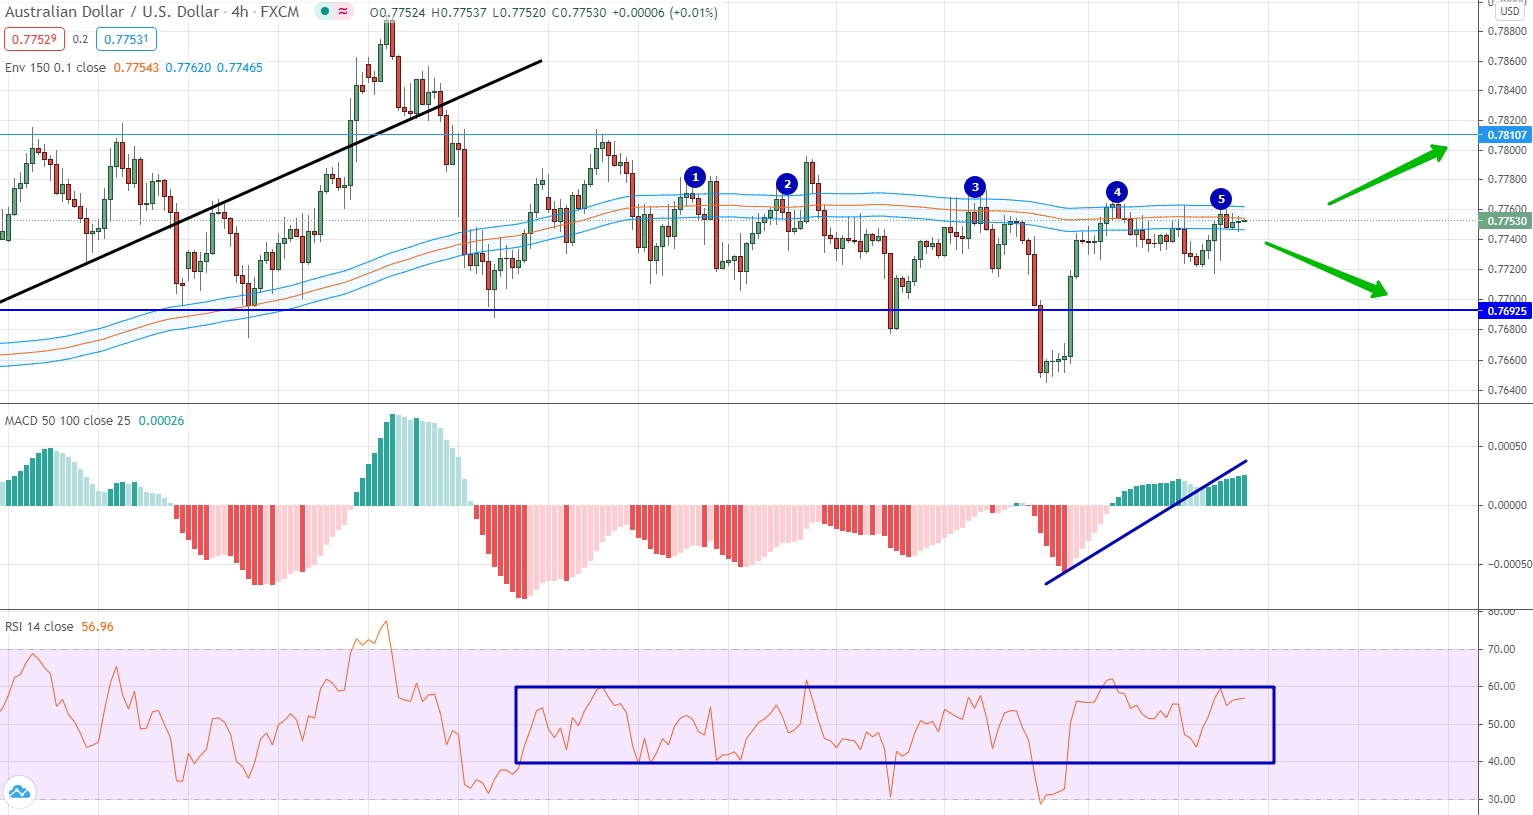
The Australian dollar against the US dollar develops horizontally and the level of moving averages is very significant for this currency pair. If you look at the chart, we see at least 5 cases over the past few weeks when the market approached the moving averages from below and each time this was reflected in the form of a rebound downward, or at least in a slowdown. Indicators, as well as for other currency pairs, do not give any signals for trading, therefore, we operate exclusively with price readings. Taking into account that the market has recently tested the moving averages again, we can expect a rebound downward, and open a contract for a fall with the target at 0.7692. If the market manages to gain a foothold above the moving averages, then it will be possible to open an upward contract with the target at 0.7810.
USD/CAD
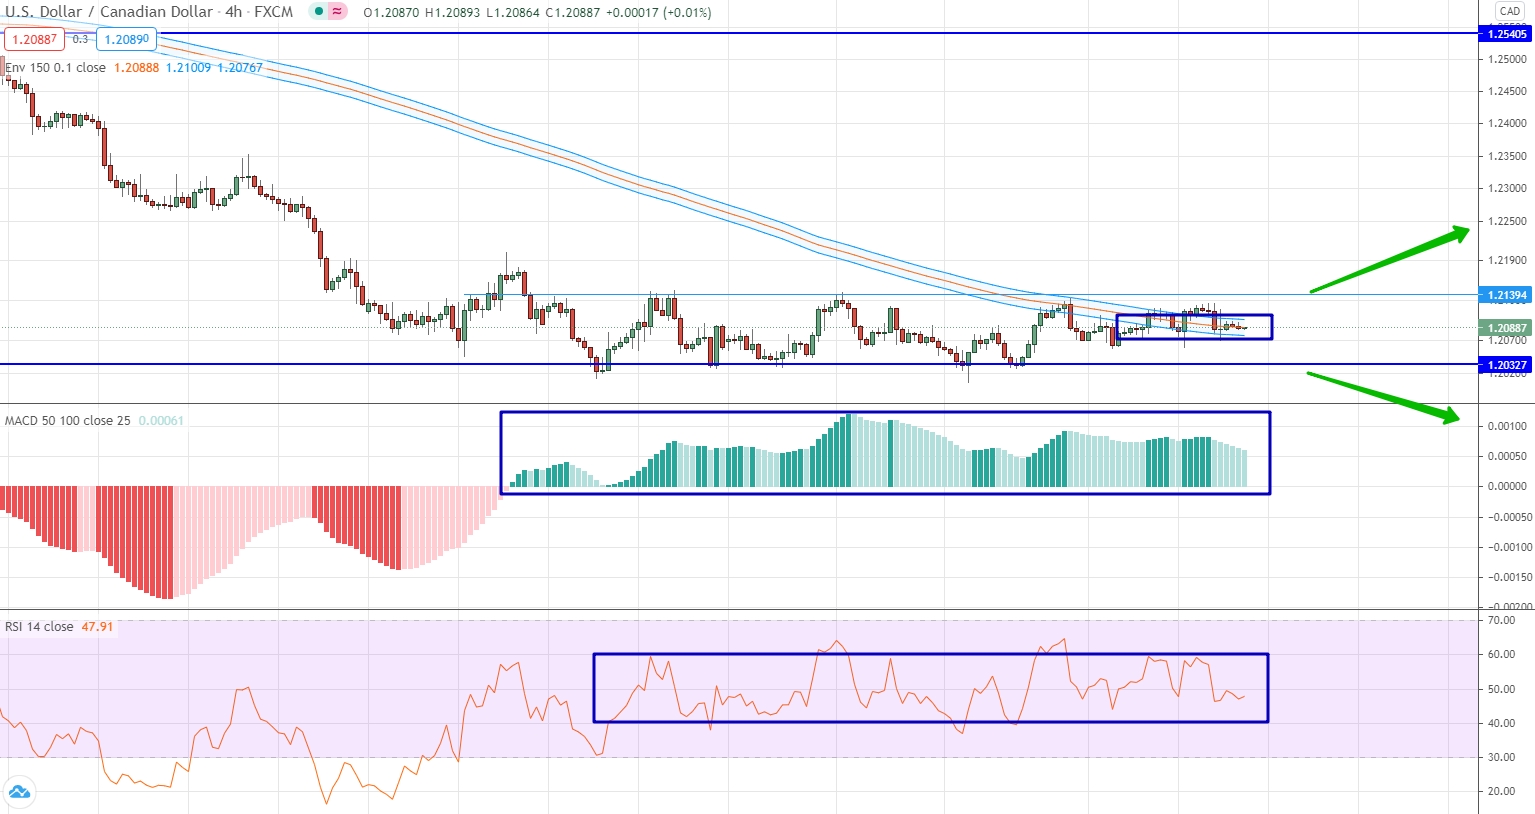
The US dollar against the Canadian dollar is still recovering after strong sales of previous weeks, and continues to develop within the sideways range of 1.2140 and 1.2032. The absence of a trend movement can be seen very well from the oscillator, which cannot move away from the neutral level. Although the histogram is in the positive area, it does not give signals, and it is not necessary to perceive its signals now, since it also comes to its senses after strong sales. We also pay attention that the current price coincides with the moving averages. This is a sign of uncertainty, which means that you cannot trade. We look forward to a breakout and open a contract in the direction of the breakdown.
USD/CHF
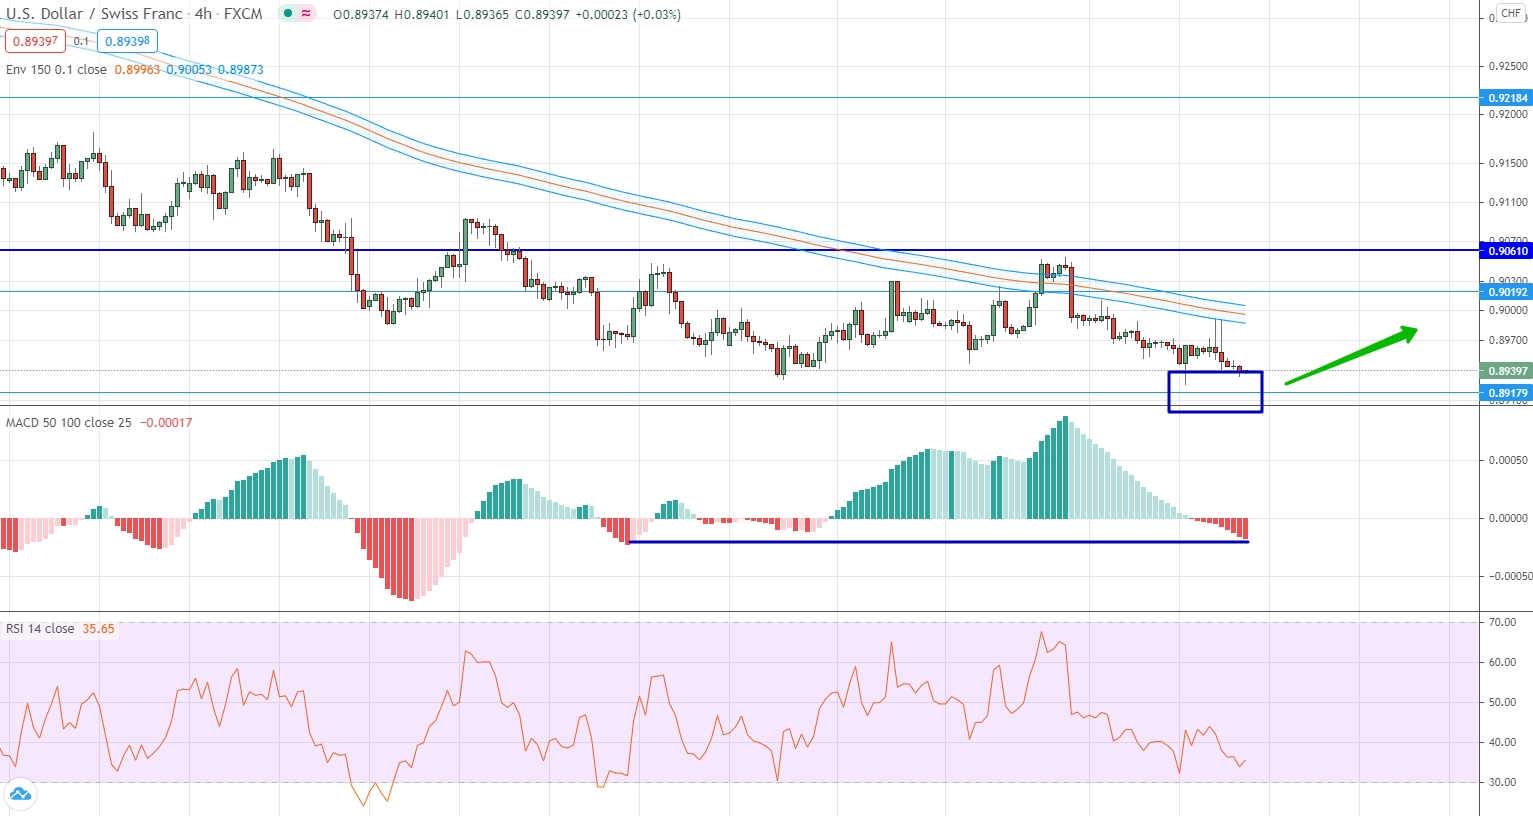
The dollar continues to lose ground against the Swiss franc. The past week again led to a fairly strong downward movement, as a result of which the price practically reached the important level of 0.8918. Indicators are also making a downward movement and testing local minimum values. This applies to both the oscillator and the histogram. However, all indicators also demonstrate the presence of an opportunity for the continuation of the downward movement. Nevertheless, given the presence of an important price level, we expect a corrective upward movement and it is possible to open an up trade with a target at the level of the moving averages.
USD/RUB
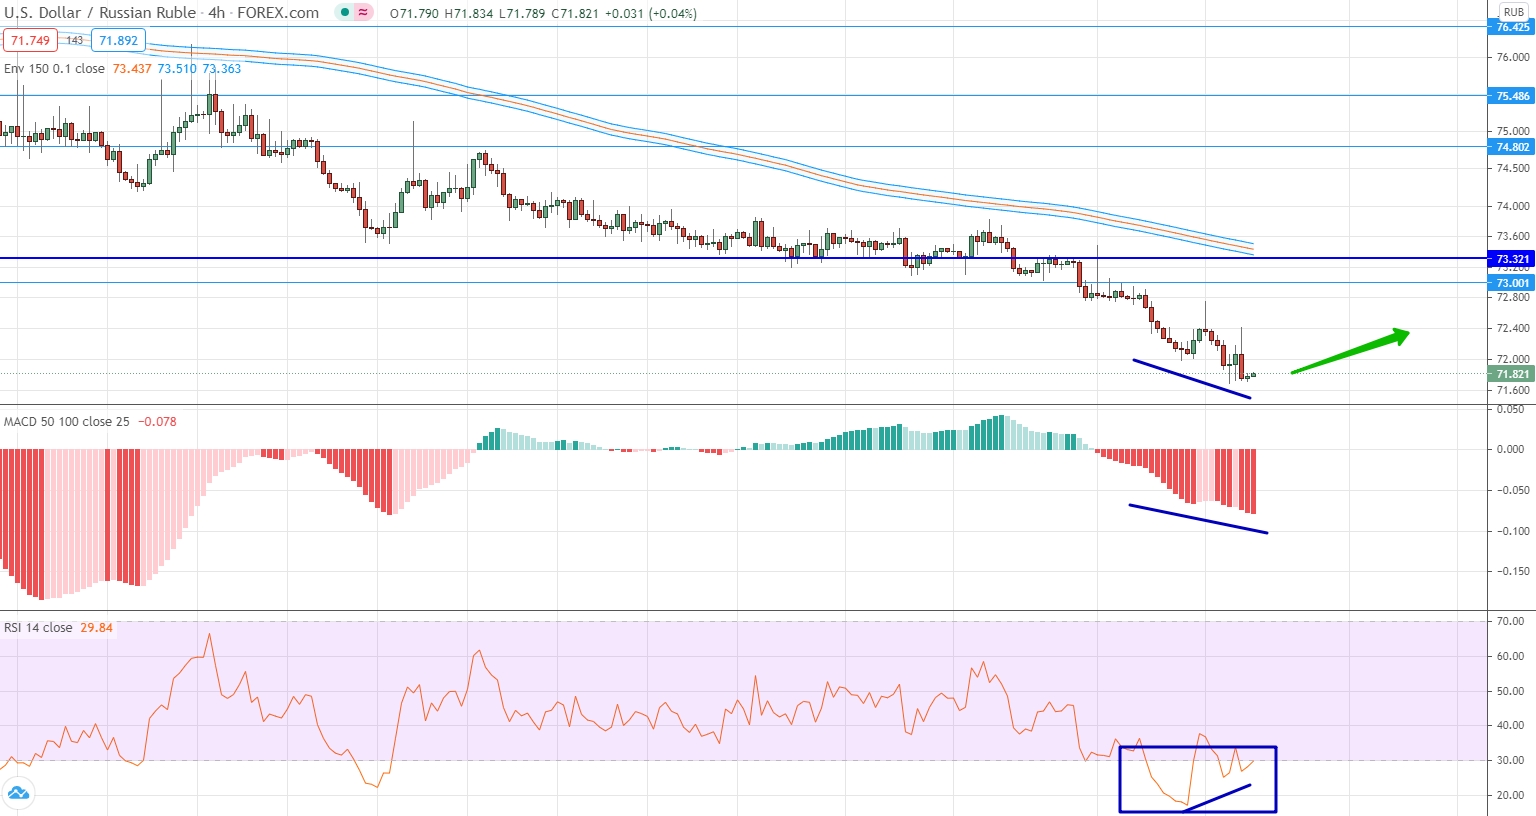
The US dollar has depreciated significantly against the Russian ruble last week. As a result, the value of this currency pair was even lower than 72.00. The market is at its local minimum value and confirms the significance of the downtrend. Nevertheless, it is impossible to open a downtrend contract now, since the downward movement is already under way, and we were late for it. If we consider the price chart in conjunction with the oscillator, then there is a divergence. Therefore, we can count on a corrective upward movement, which means we open a contract for an increase.
Gold
Gold continues to form an uptrend, although it cannot rise above the wet level of 1909.434. Interestingly, within the last weeks, the price of gold has twice tested the moving averages from top to bottom, and twice this led to a fairly strong upward movement. Moreover, the reaction took place instantly. Now the price is close to the designated level and until this level is tested it will not be possible to trade. We are waiting for testing the level and in which direction the market will go from it. In the direction of movement, you can open a deal.


